
Understanding Our Pest Management Methods
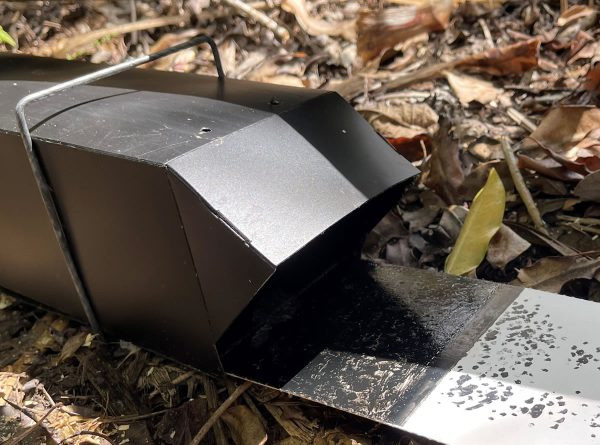
Tracking Tunnels — Rodents and Mustelids
Tracking tunnels provide a simple and nationally established way of measuring the relative activity of small mammalian pests.
Inked tracking cards record the footprints of animals passing through the tunnels, allowing the proportion of tunnels visited by each species to be calculated as a Tracking Index.
Historically, Hikaroroa has used a standard one-night peanut-butter survey for rats and mice, together with longer salted-meat surveys targeting stoats, ferrets and weasels. Following several years of baseline monitoring, the programme has moved toward a more efficient annual survey that combines peanut butter and fresh-meat lures over seven-night period. This should improve sensitivity to Hikaroroa's naturally low rodent densities while retaining the ability to detect mustelids and hedgehogs.
Tracking tunnels do not provide an estimate of the exact number of animals present. Instead, they allow us to compare activity between years and assess whether pest populations are increasing, decreasing or remaining stable.
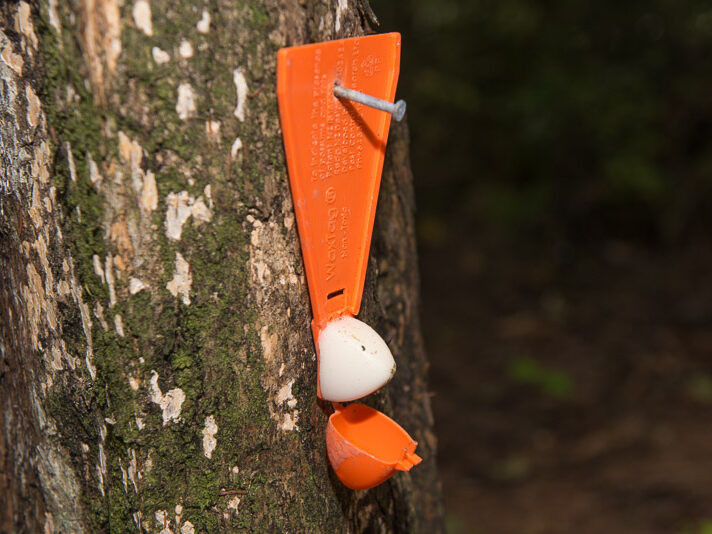
Wax Tags — Possums
Possum abundance is monitored using Wax Tag Indices (WTI).
Wax-tags are left in place along repeatable transects for seven nights. Possums investigate and bite the wax, leaving distinctive tooth marks that can be identified when the tags are collected.
The proportion of tags bitten is calculated as a Wax Tag Index, giving us a repeatable measure of relative possum abundance through time.
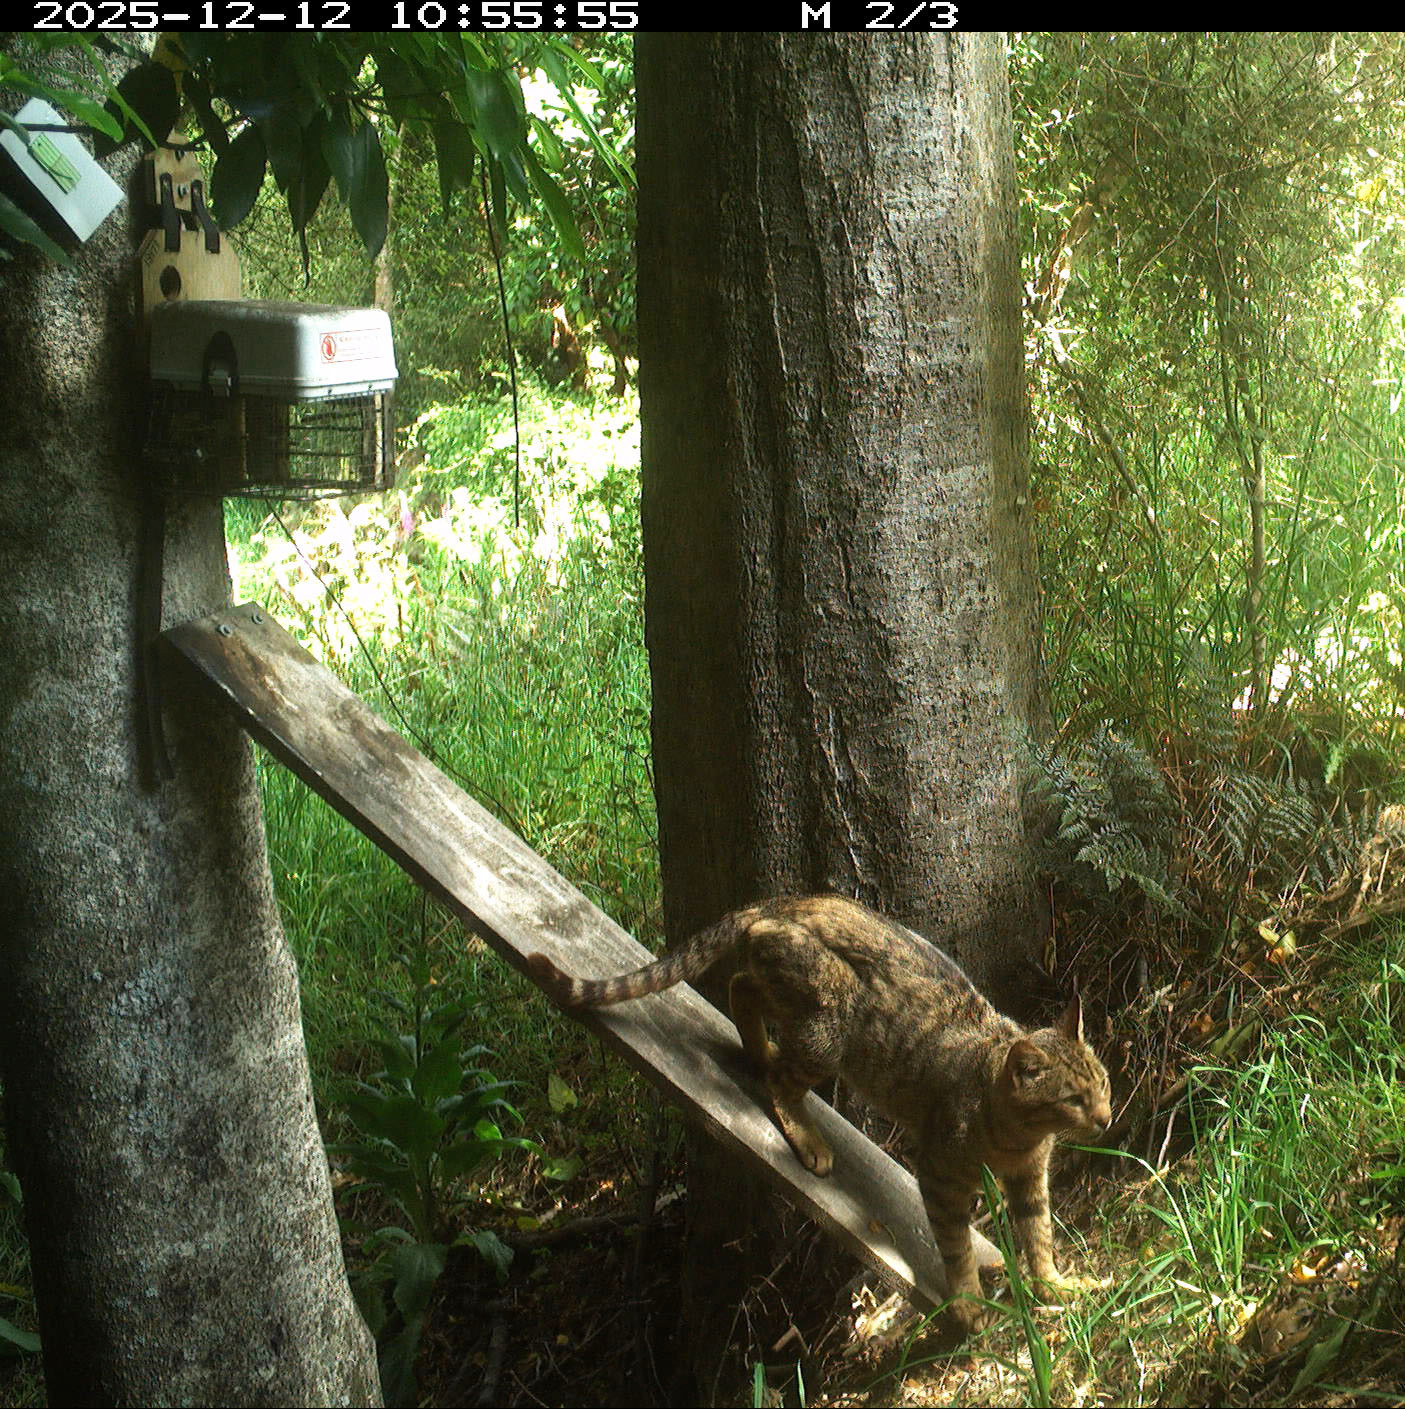
Predator Camera Surveys — Feral Cats and Mustelids
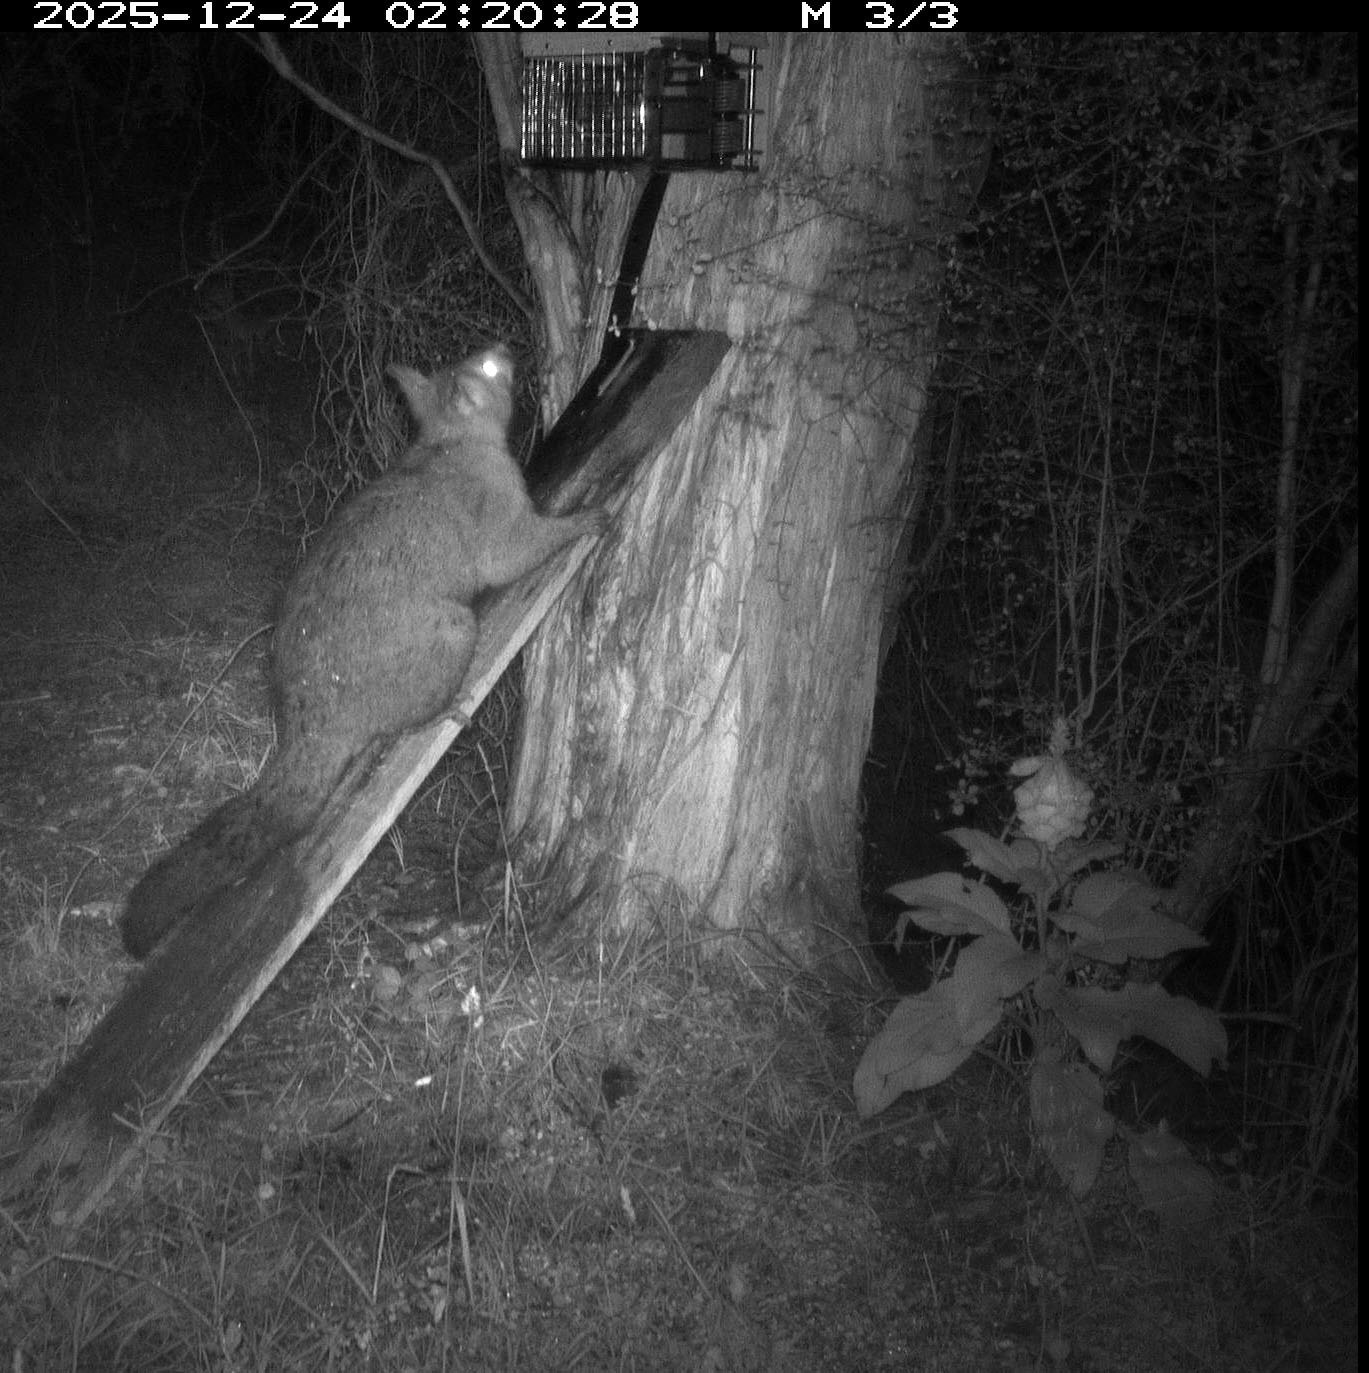
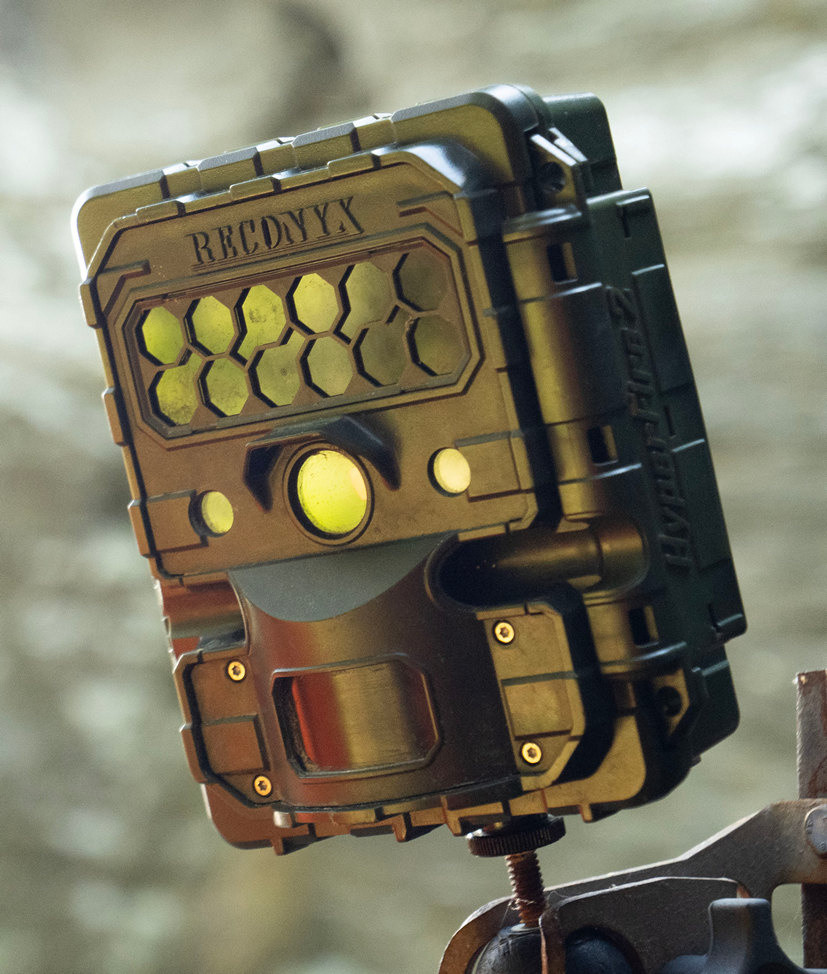
Remote trail cameras allow us to monitor larger and more mobile predators that can be difficult to measure reliably with tracking tunnels alone, particularly feral cats.
The project currently uses 20 predator camera sites. Within the Scenic Reserve, cameras provide broad coverage at approximately an 800 metre spacing, while monitoring locations on surrounding private land are integrated with existing tracking-tunnel transects.
Cameras are baited with fresh rabbit meat secured inside a wire cage. Images are recorded in three-photo bursts, with a delay between triggers to reduce repeated photographs of the same animal.
Detections are standardised against the amount of time each camera has been operating. Results are expressed as the average number of detections across 1000 hours, and that index is then compared over years to indicate population change.
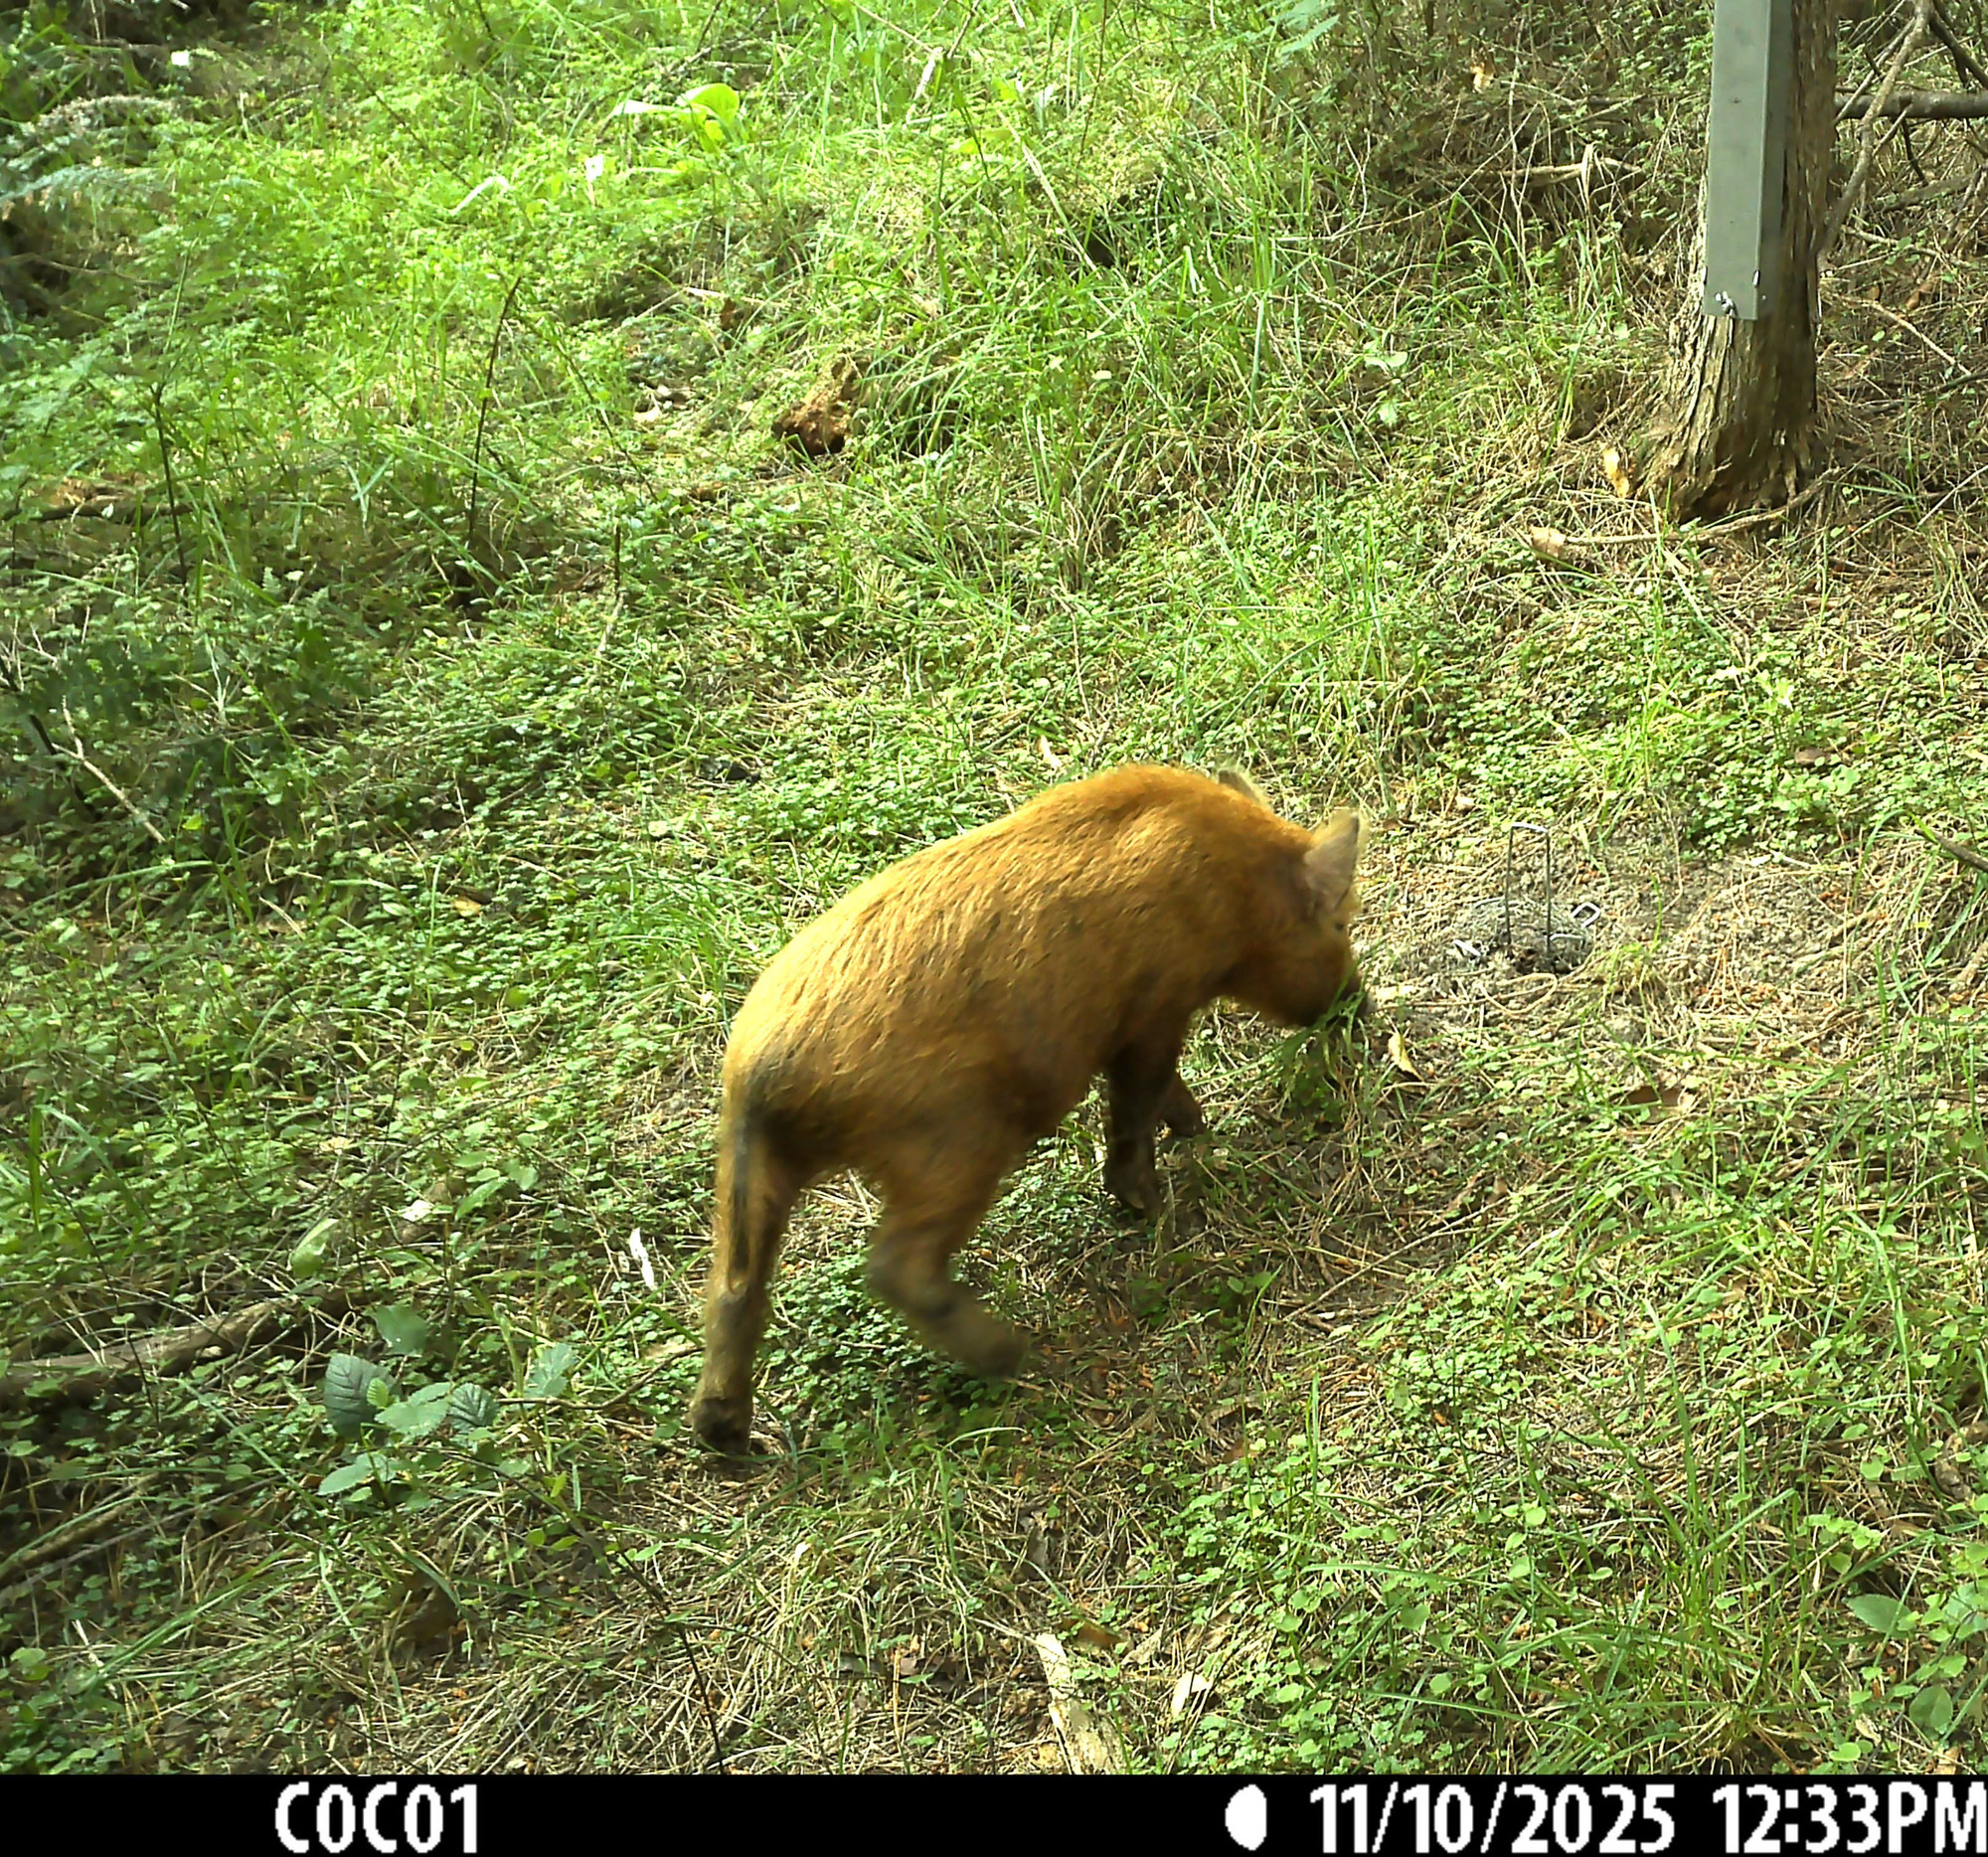
Ungulate Camera Surveys — Deer, Goats and Pigs
Deer, goats and pigs present a different monitoring challenge. Hunting records provide useful information about control operations, but the number of animals encountered or killed can also be affected by weather, vegetation, hunter experience, animal behaviour and the amount of hunting undertaken.
To provide an independent measure of abundance, we have incorporated the Department of Conservation Ungulate Camera Trap Index protocol into the existing Hikaroroa camera network. The programme currently uses 11 monitoring cameras within the Scenic Reserve and nine across surrounding HMWCG-managed land.
Motion-activated cameras can remain operating for extended periods, sampling the landscape continuously without the influence of a person being present. Deer, goat and pig activity is then expressed as independent encounters per 1,000 camera hours.
Over time, this dataset will be compared with forest regeneration monitoring. Our long-term objective is to identify measurable ecological thresholds — the level of deer, goat and pig detections below which palatable native seedlings recruit successfully.